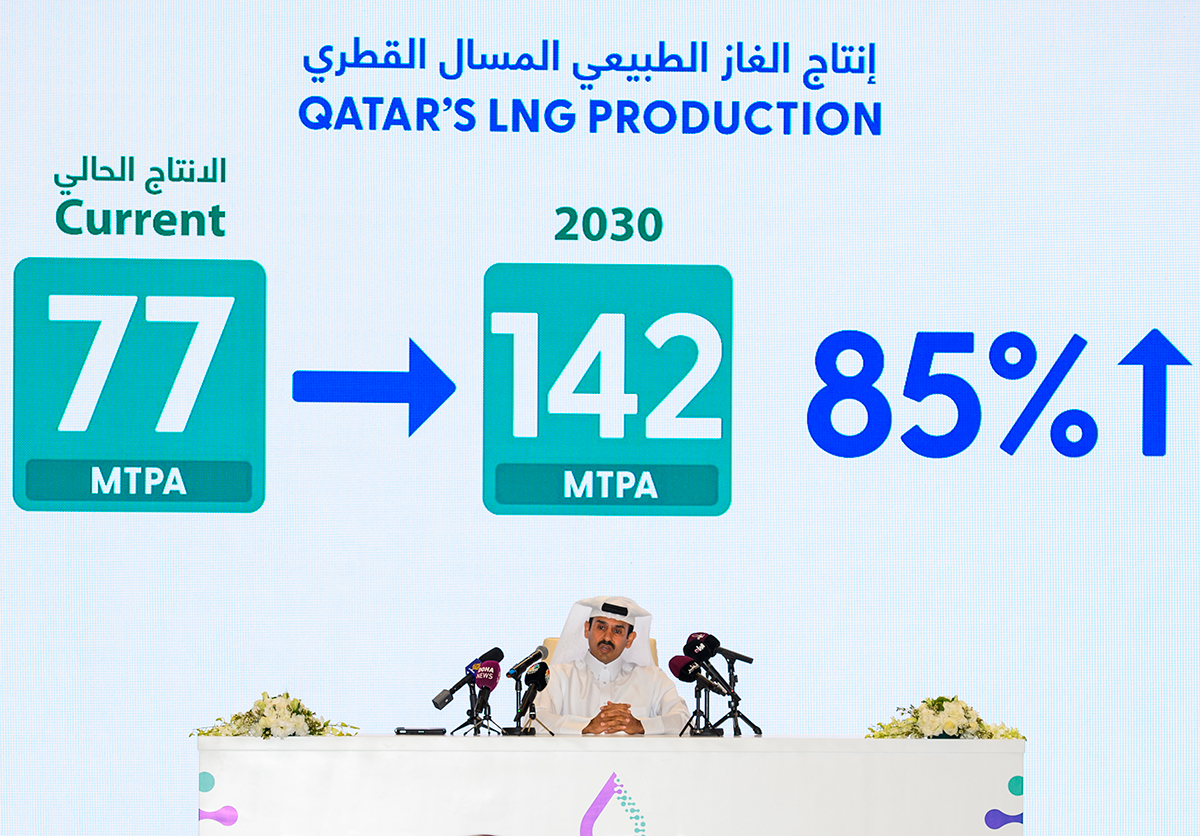
On Feb. 25, 2024, the Qatari minister of energy and CEO of QatarEnergy (QE), Saad al-Kaabi, announced plans to increase Qatar’s liquefied natural gas (LNG) production capacity by a further 16 million tons per annum (mtpa) in 2029-30, bringing the total to 142 mtpa. This would be the third such large-scale expansion of the country’s LNG production within the next six years. The so-called North Field West (NFW) expansion will be preceded by two other previously announced expansion projects: the North Field East (NFE) expansion (totaling 32 mtpa) in 2026-27 and the North Field South (NFS) expansion (totaling 16 mtpa) in 2027-28. There would be nothing unusual about this decision by the Qatari authorities were it not for one fact: These new production volumes are set to come online at a time of significant oversupply in the LNG market.
It is estimated that global LNG production will grow by at least 40% in 2025-30 compared to 2022-24. According to Bloomberg, this massive increase in supply will initiate a new supercycle largely driven by the US and Qatar, which will remain the market leaders for decades to come, although Russia, Mexico, Canada, and some other countries in the Middle East and Africa will also add to the growth of global LNG production capacity (Table 1).
Table 1. Global LNG Production Growth by 2027 (mtpa)
|
|
Capacity Growth |
2027 Total |
|
US |
78 |
169 |
|
Qatar |
49 |
126 |
|
Middle East & Africa* |
23 |
93 |
|
Australia |
5 |
92 |
|
Southeast Asia |
6 |
66 |
|
Russia |
20 |
49 |
|
Canada & Mexico |
19 |
19 |
Source: Bloomberg *Excluding Qatar
Experts are already calling this increase the third global LNG wave, after the first two in 2003-10 and 2015-20, when first Qatari and then American and Australian LNG volumes poured into a market that was not ready to consume them. As happened with the first two, this third wave is also expected to create a glut. According to estimates from the Oxford Institute for Energy Studies (OIES), by 2030 the volume of LNG production capacity will exceed demand by 6-13%, depending on the scenario.
The 2030 issue
Under these circumstances, QE’s decision to increase production capacity by another 16 mtpa might seem controversial as it will further saturate the market, discourage LNG price growth, and, most importantly, challenge the country to find long-term buyers for these volumes during a market glut. The latter issue is particularly important, as Qatar traditionally focuses on long-term contracting of its LNG production volumes to guarantee the sustainability and predictability of its export revenues. Market oversupply and, consequently, low spot prices typically discourage consumers from signing long-term contracts. As of spring 2024, there has already been speculation that some Asian buyers of Qatari gas — market experts interviewed by the author on condition of anonymity mentioned Japan, South Korea, and even China — were trying to avoid signing new long-term LNG supply contracts and even questioning the need to extend existing purchase agreements. In the 2025-35 period, Doha will not only face the challenge of contracting new volumes, but also the question of what to do with existing and expiring contracts, as a lot of old purchase agreements are due to be renewed then (see Table 2).
Table 2. Qatar LNG Contracts Effective After 2024
|
Buyer |
Market |
Volume (mtpa) |
Validity |
|
Petronet |
India |
7.5 |
2028-48 Extension of existing contracts (2004/09) |
|
Sinopec |
China |
3 |
2027/28-2054/55 |
|
CNPC |
China |
4 |
2026-53 |
|
Sinopec |
China |
4 |
2026-53 |
|
TotalEnergies SE |
France |
3.5 |
2026-53 |
|
ConocoPhillips |
Germany |
1 |
2026-41 |
|
ConocoPhillips |
Germany |
1 |
2027-42 |
|
Eni |
Italy |
1 |
2026-53 |
|
Excelerate Energy |
Procurement in Bangladesh |
1 |
0.85mt: 2026-27 |
|
South Korea’s Energy Ministry |
South Korea |
2 |
2025-45 |
|
Shell |
Netherlands |
3.5 |
2026-53 |
|
CNOOC |
China |
3.5 |
2022-36 |
|
CPC |
Taiwan |
1.25 |
2022-36 |
|
Kuwait Petroleum Corporation |
Kuwait |
3 |
2022-37 |
|
Pakistan State Oil |
Pakistan |
3 |
2022-31 |
|
Shell |
Delivered to Chinese terminals |
1 |
2022-31 |
|
Sinopec |
China |
2 |
2022-32 |
|
Suntien Green (S&T International) |
China |
1 |
2022-37 |
|
Vitol |
n/a |
1.25 |
2021 |
|
Pakistan State Oil |
Pakistan |
3.75 |
2016-31 |
|
PetroChina |
China |
3.4 |
2018-40 |
|
TotalEnergies |
France |
5.2 |
2009-34 |
|
CNOOC |
China |
2 |
2011-35 |
|
JERA |
Japan |
0.7 |
2013-28 |
|
Kanasi Electric |
Japan |
0.5 |
2013-27 |
|
ORLEN |
Poland |
1.1 |
2015-34 |
|
ORLEN |
Poland |
0.9 |
2018-34 |
|
PTT |
Thailand |
2 |
2015-34 |
|
RWE Supply & Trading |
Germany |
1.1 |
2017-24 |
|
Tohoku Electric |
Japan |
0.18 |
2016-30 |
|
OMV |
Austria |
1.1 |
2019-24 |
|
PetroChina |
China |
3 |
2011-36 |
|
Shell |
Kuwait |
1 |
2020-n/a |
|
Endesa |
Spain |
0.75 |
2005-25 |
|
KOGAS |
South Korea |
4.92 |
1999-2024 |
|
Edison |
Italy |
4.6 |
2009-34 |
|
CPC |
Taiwan |
3 |
2008-32 |
|
EDF Trading |
UK |
3.4 |
2007-27 |
|
ENI |
Italy |
2.05 |
2007-27 |
|
GAIL, IOCL, BPCL and GSPC |
India |
1 |
2016-28 |
|
KOGAS |
South Korea |
2.1 |
2007-26 |
|
CPC |
Taiwan |
1.5 |
2013-32 |
|
KOGAS |
South Korea |
2 |
2012-32 |
|
Petrobangla |
Bangladesh |
2.5 |
2018-33 |
Sources: Author calculations based on the data by GIIGNL, MEES, oilandgasmiddleeast.com
Yet the market oversupply might discourage customers from renewing these agreements or may prompt them to renegotiate contract conditions in a way that is less favorable for QE. As a result, while Qatar will have 73% of its LNG volumes contracted in 2027, this figure could fall to as low as 59% in 2030 and 34% in 2035 (see Table 3), leaving Doha with a significant amount of LNG on its hands and the task of finding a buyer for it in an oversaturated market.
Table 3. Qatar LNG Exported Under Long-Term Contracts in 2024-35
|
|
Volume (mtpa) |
Share of Existing |
|
Volumes contracted after 2024 (including those to be exported after the production expansion) |
92.08 |
n/a |
|
Volumes contracted after 2027 |
85.33 |
73 |
|
Volumes contracted after 2030 |
83.45 |
59 |
|
Volumes contracted after 2035 |
48.9 |
34 |
Sources: Author calculations based on the data by GIIGNL, MEES, oilandgasmiddleeast.com
The expected glut will increase market competition between LNG producers, and this competition will have several important dimensions. On the one hand, Qatar will face increasing competition in its main market, Asia, which will remain almost the only one available to QE given an expected oversupply of natural gas in other regional markets or a reduction in their import needs. Thus, in 2022-50, the demand for natural gas in Europe should fall from 480 bcm to 300 bcm, making it an unpromising market for new LNG volumes. According to estimates from the Gas Exporting Countries Forum (GECF), in the period 2022-50 the Asia-Pacific region will account for more than 52% of the increase (700 bcm) in global demand for natural gas, driven by demand growth in India, China, and Southeast Asia, thus attracting excess volumes. Yet QE will need to compete for this market share with other players, including producers from the US, its traditional economic and political partner. And the competitiveness of Qatar’s market rivals should not be underestimated. Traditionally, QE is considered to have the most customer-oriented approach. However, this is not always true: The main complaints of Qatar’s clients are often connected to the delivery conditions Doha imposes, which often include clauses prohibiting the resale of gas to third parties or changing the route of volumes that have already been purchased. In this sense, US producers provide much more flexible terms. The pricing formula for Qatari contracts remains a separate issue: QE traditionally ties its LNG prices to the price of oil, whereas its competitors are trying to use gas-indexed prices (linked to, in the case of the US companies, Henry Hub prices) that are more attractive when conditions in the global oil market are unstable and unpredictable.
At the same time, the Asian market itself is also experiencing significant changes. Attempts to diversify the types of energy resources used and the growing interest of Asian players in renewables as well as some other economic and political considerations may constrain LNG demand growth. Thus, in the long term, demand for LNG imports is expected to fall in Japan and South Korea. China’s active interest in the development of renewable energy also makes it difficult to predict its future LNG demand, although it continues to be considered, along with India and the developing countries of the Asia-Pacific region, the main engine of LNG demand growth.
And, still, the Qatari decision is a justified risk. Doha has a high chance of success in the struggle for market share for three main reasons: the country’s natural competitive advantages, its strategy of working with consumers and competitors, and the multivariate development of the situation beyond 2030-35.
Natural advantages
When it comes to Qatar’s natural advantages, its low cost of LNG production, fleet of LNG carriers, and convenient geographical location, which allows for the redirection of LNG export flows in line with the changing dynamics of the regional gas markets, can be considered key to the country’s success in the future struggle. Qatar has one of the lowest (if not the lowest) unit costs of LNG production. According to Reuters, it is “as low as $0.3/mmBtu, versus $3-$5/mmBtu globally, as associated liquids production pays for most of the LNG construction costs, and as access to cheap labor from southeast Asia prevents projects ballooning in cost or slipping behind schedule.” Some other analysts put this figure a bit higher at $2-3 per mmBtu while noting that profits from associated liquids production basically bring it close to zero. On pricing Qatar’s competitors are somewhat less advantageously positioned, even in the case of the US, Australia, and Mozambique, which are closer to the middle or upper levels of this range. Under these circumstances, Qatar’s cheap and massive LNG production and ability to adjust the flow of exports are two of its key competitive advantages in the struggle for market share in an oversupplied market.
All on board
The second factor that raises Qatar’s chances for success in the coming market war is its strategy of coopting potential clients and rivals. From the very beginning of its LNG sector build-up, Doha gave large consumers and international energy firms direct access to its LNG sector by providing stakes in its development. Moreover, Qatar was always trying to fit its interactions with rivals and consumers into its broader strategy of building maximum control over the producer-supplier-consumer chain. In other words, international partners are supposed to not only help QE develop its production capacity, but also ensure the sale and marketing of its LNG. Qatar has already extended this strategy of involving competing partners and potential clients to the expansion projects (Table 4).
Table 4. Shareholder Structure for NFE and NFS Expansion (%)
|
|
North Field East Expansion |
North Field South Expansion |
|
QatarEnergy |
72.5 |
73.1 |
|
TotalEnergies |
6.3 |
9.4 |
|
ExxonMobil |
6.3 |
n/a |
|
Shell |
6.3 |
9.4 |
|
Eni |
3.1 |
n/a |
|
ConocoPhillips |
3.1 |
6.3 |
|
Sinopec |
1.25 |
1.9 |
|
CNPC |
1.25 |
n/a |
Source: MEES
Given the expected growing rivalry for the Asian market, QE is trying to place more emphasis on coopting Asian consumers. In April 2023, China’s Sinopec became the first Asian company to receive a stake in the NFE expansion, with 1.25%, followed later by a 1.9% stake in the NFS expansion. Moreover, the process of obtaining a share in the expansion project went along with signing the longest possible contract (27 years) for the purchase of Qatari gas. This approach became a pattern, and it was used as a blueprint by Doha when working with CNPC.
Event horizon
Finally, Qatar’s planning horizon extends beyond 2030, and that’s when the market picture may begin to diverge from that of the late 2020s, significantly impacting the thinking of Doha’s decision-makers. To begin with, there are several probable scenarios for the development of the situation in 2030-50, all of which involve the end of the market oversupply by the early 2030s and a more or less predictable market afterward.1 The first group of scenarios implies the rebalancing of LNG supply and demand in the early-to-mid 2030s and relatively slow and marginal growth afterward. Thus, the International Energy Agency (IEA) argues that, in 2030, the volume of global LNG trade will amount to 611 mtpa against 479 mtpa in 2022, while by 2050 it will grow only to 656 mtpa. The variations of this scenario do not exclude the more active growth of demand and supply, but, at the same time, they do not exclude the existence of both unused liquefaction and regasification capacities in the long run either.
The alternative group of scenarios (proposed, for example, by McKinsey analysts) argues that the natural development of the forthcoming supercycle implies not only the rebalancing of the market after 2030 but also growing demand and the emergence of a subsequent deficit that will only be addressed by 2050 or later. According to some estimates, in the 2040s, the deficit may amount to 30-60 mtpa. Moreover, the 2030s and 2040s might be the last golden age for LNG producers. The coming energy transition and the resulting reduction in demand for hydrocarbons will reduce demand for natural gas after 2050 and ensure that there will never be another golden era. Consequently, in order to take advantage of this opportunity, it is necessary to start preparing liquefaction facilities right now — and that’s exactly what QE is doing.
One solution for all scenarios
Moreover, even if the market undersupply scenario does not come about, QE still has an almost ideal starting position in the competition for LNG markets in the coming decades. Low production cost, a central location, and its already concluded contracts will increase Doha’s chances of living through the period of critical oversupply in the late 2020s and early 2030s with minimal losses to enter the more stable 2030s and 2040s. It still has most of its gas contracted during the most crucial period of oversupply and a significant decrease in the share of contracted gas is expected only after 2035, which will allow Doha to redistribute its regular customers in accordance with the post-2030 trends and sign new long-term contracts. As such, Qatar’s success in navigating the troubled waters of the regional LNG markets will be determined by its ability to use its existing natural advantages, successfully manage relations with its main market rivals and clients, and exploit the opportunities provided by the multivariate future after 2030.
Dr. Nikolay Kozhanov is a research associate professor at the Gulf Studies Center of Qatar University and a Non-Resident Scholar with MEI’s Program on Economics and Energy.
Photo by VCG/VCG via Getty Images
Endnote
1 The doomsday scenarios implying a significant reduction in LNG consumption are considered as less probable as they require international players to make much greater efforts now to accelerate the processes of the fourth energy transition. Such a scenario looks somewhat unlikely due to the insufficient motivation of the international community, as well as objective economic and political factors, but it should not be completely excluded from consideration.
The Middle East Institute (MEI) is an independent, non-partisan, not-for-profit, educational organization. It does not engage in advocacy and its scholars’ opinions are their own. MEI welcomes financial donations, but retains sole editorial control over its work and its publications reflect only the authors’ views. For a listing of MEI donors, please click here.
The Other MoU: Launching a Europe-Gulf Resilience Initiative After the US-Iran Deal